Unveiling Interfaces and Structures: Cryogenic Laser Ablation and Plasma Focused Ion Beam Techniques for Complex and Beam-Sensitive Systems
Characterization of 3D Volumes
Characterization Approaches for Large 3D Volumes
To better understand the mechanisms that drive the behavior of complex multiphase materials systems (including coin cells whose heterogeneity is increased over the course of battery cycling Jungjohann et al., 2021), it is useful to analyze both representative areas and volumes. Previously, MicroCT and NanoCT have been used to non-destructively study 3D structures within partial and complete battery stacks Lu et al., 2020. We were able to obtain high-quality cross-sections of the coin cells, with vastly improved clarity in the ROI compared to MicroCT (Figure 4.1, Figure 4.2 ). Figure 4.1 (a) shows a sample after UPL ablation was performed to remove bulk material (~1 x 0.9 x 0.7 mm), including the steel casing, around the cell ROI which is outlined in red. We can clearly resolve interfaces between the casing, copper current collectors, electrolyte, solid electrolyte interphase (SEI), polymer separator, and lithium metal. Figure 4.1 (b) shows higher magnification for the ROI, revealing the cell morphology. For clarity, we have applied false color to the image, clearly distinguishing lithium metal deposits embedded in the electrolyte + SEI layer. Figure 4.2 (a) shows MicroCT data collected on a Zeiss 560 Nano Focus, which shows the full coin cell assembly (spacers, casing, etc.); Figure 4.2 (d) shows a magnification of the ROI (current collectors, Li, electrolyte/SEI, separator) with extremely low-resolution. To emphasize the comparatively high quality of this image, we would like to highlight that all components in the ROI are distinguishable in the UPL-prepared cross-section SEM image Figure 4.1(b) whereas no details are distinguishable in the equivalent ROI by MicroCT Figure 4.2(b). Based on EDS, BSE image contrast, and LIPSS that differ between SEI vs. Li (discussed in Influence of Laser Parameters) deposits of Li metal could be identified in the top electrolyte + SEI layer. However, as shown in Figure 4.1, MicroCT of a coin cell can show the complete stack, but cannot resolve or differentiate key components in the ROI (e.g., electrolyte/SEI, separator, and Li metal) due to the low X-ray transparency of the stainless-steel casing, which increases the number of imaging artifacts. A recently demonstrated transparency window offers a promising avenue for future enhancements in MicroCT resolution but, at present, this technique is still poorly suited for resolving stack components in an assembled coin cell because the window can compromise the electrochemical properties Tan et al., 2018.
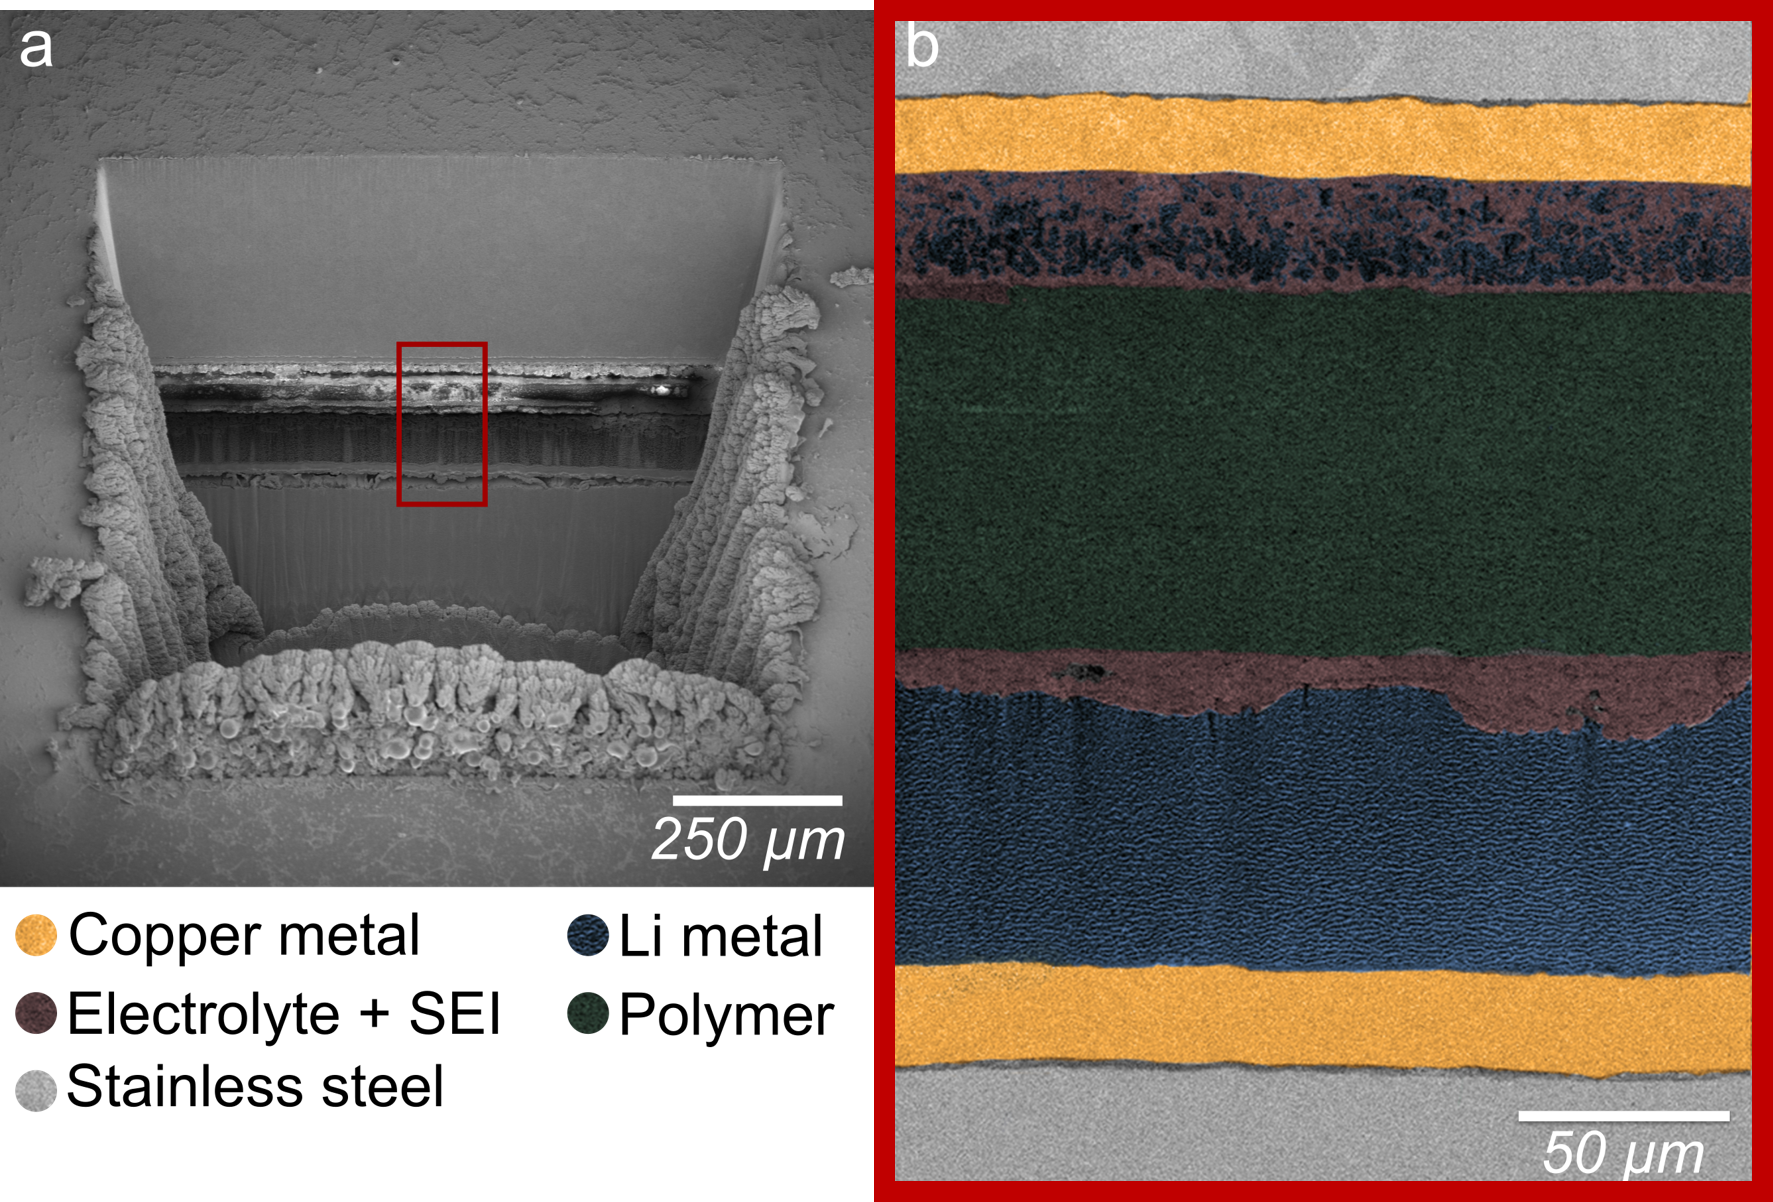
Figure 4.1:Comparison of UPL-prepared SEM and MicroCT characterizations on the same representative ROI in identically prepared half coin cells with concentrated bisalt electrolyte cycled to 100.5 cycles at low rate. a) Overview of a cryo-SEM SE cross-section image collected at 5 kV, 0.69 nA of a ~1 x 0.9 x 0.7 mm region in a coin cell battery removed with UPL ablation, where the ROI is marked with a red box. b) Higher magnification cryo-SEM BSE image of the ROI collected at 2 kV, 0.69 nA.

Figure 4.2:Comparison of UPL-prepared SEM and MicroCT characterizations on the same representative ROI in identically prepared half coin cells with concentrated basalt electrolyte cycled to 100.5 cycles at low rate. a) MicroCT scan of full coin cell assembly. b) Virtual slice from the ROI region marked with red box in a), inset in the bottom right shows top down scan of the coin cell.
Fortunately, the Laser PFIB can be used to collect high-quality automated ‘slice-and-view’ data, alternately using UPL ablation and SEM imaging to capture slices of data that can then be reconstructed to obtain a 3D dataset. Depending on the quality of 3D imaging required, slice thickness can be adjusted by moving the beam or stage positions; using the most recently developed Helios Laser PFIB, more advanced automated (e.g. EDS, ESBD) workflows can also be incorporated. For our initial 3D demonstration, we used the prototype Helios Laser PFIB to create 2.5 m slices and capture BSE images of each slice, as shown in Figure 4.5. To eliminate the redeposition at the edges of the sliced field of view, the images were cropped from 500 m to 316 m; however, as an alternative to cropping, it is possible to prepare a post to remove material from both sides of the ROI to minimize redeposition. Our images were aligned with reference to the Cu current collectors and polymer separator. The slices (total volume 316 x 281 x 152 m) were then reconstructed with Avizo software to reveal a segmented reconstruction of the Cu, Li metal, and polymer separator (Figure 4.3). The results offer unique insight into the sample’s morphology, while retaining nanoscale resolution for each of component of the multiphase system. Qualitative observation of the uniformity of the Cu current collectors showed variation in both roughness and thickness. Further study of the Li morphology on either side of the separator showed that pits on the bottom of the Li layer correspond to protruding Li grains on the top of the Li layer, which are not obvious in single frames a cross-sectional area in Figure 4.4.

Figure 4.3:3D reconstruction of automated laser slice-and-view collection in a coin cell showing segmented Cu (yellow) and Li metal (blue). The polymer separator, SEI, and liquid electrolyte have been excluded to show disconnected Li metal. Total volume 316 x 281 x 152 m.

Figure 4.4:2D slice-and-view of automated laser coin cell crosssection showing segmented Cu (yellow) and Li metal (blue). The polymer seporator, SEI, and liquid electrolyte have been excluded to show disconnected Li metal.

Figure 4.5:2D slice-and-view of automated laser coin cell crosssection Cryo-SEM images.
- Jungjohann, K. L., Gannon, R. N., Goriparti, S., Randolph, S. J., Merrill, L. C., Johnson, D. C., Zavadil, K. R., Harris, S. J., & Harrison, K. L. (2021). Cryogenic Laser Ablation Reveals Short-Circuit Mechanism in Lithium Metal Batteries. ACS Energy Letters, 6(6), 2138–2144. 10.1021/acsenergylett.1c00509
- Lu, X., Bertei, A., Finegan, D. P., Tan, C., Daemi, S. R., Weaving, J. S., O’Regan, K. B., Heenan, T. M. M., Hinds, G., Kendrick, E., Brett, D. J. L., & Shearing, P. R. (2020). 3D microstructure design of lithium-ion battery electrodes assisted by X-ray nano-computed tomography and modelling. Nature Communications, 11(1). 10.1038/s41467-020-15811-x
- Tan, C., Daemi, S. R., Taiwo, O. O., Heenan, T. M. M., Brett, D. J. L., & Shearing, P. R. (2018). Evolution of Electrochemical Cell Designs for In-Situ and Operando 3D Characterization. Materials, 11(11), 2157. 10.3390/ma11112157

